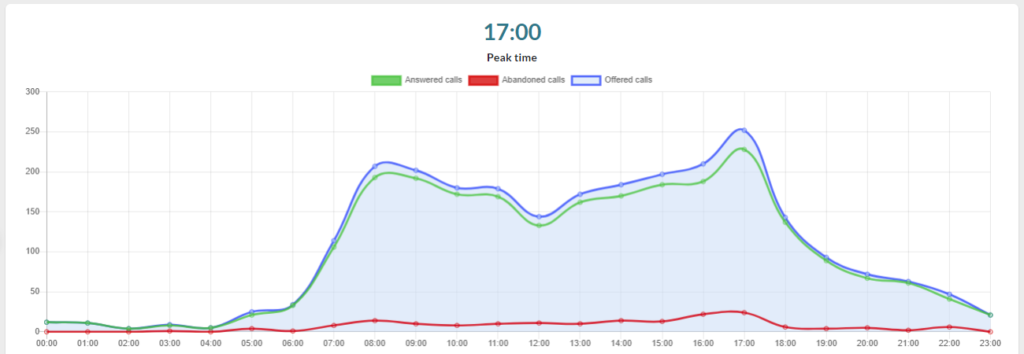
On this report, we can observe in graph form the hours with peak time of traffic on the Call Center. This information is very useful, since it helps us take decisions to know how many agents we need depending on the time. It is also possible to divide this report in half hour increments.
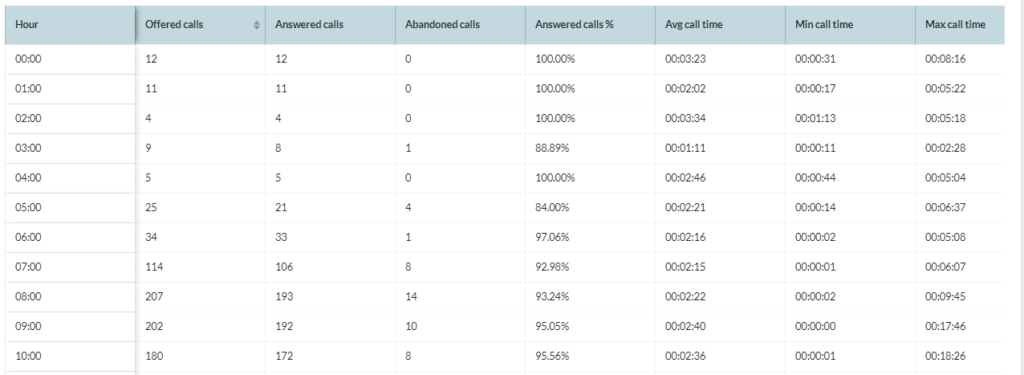
We can also see a table below the graph with the following information:
- Hour, Hour to evaluate the information.
- Offered Calls, number of calls that entered Queue.
- Answered Calls, number of answered calls.
- Abandoned Calls, number of abandoned calls.
- Answered Calls %, percentage of calls answered on this time frame
- Avg Call Call Time, average call duration by call.